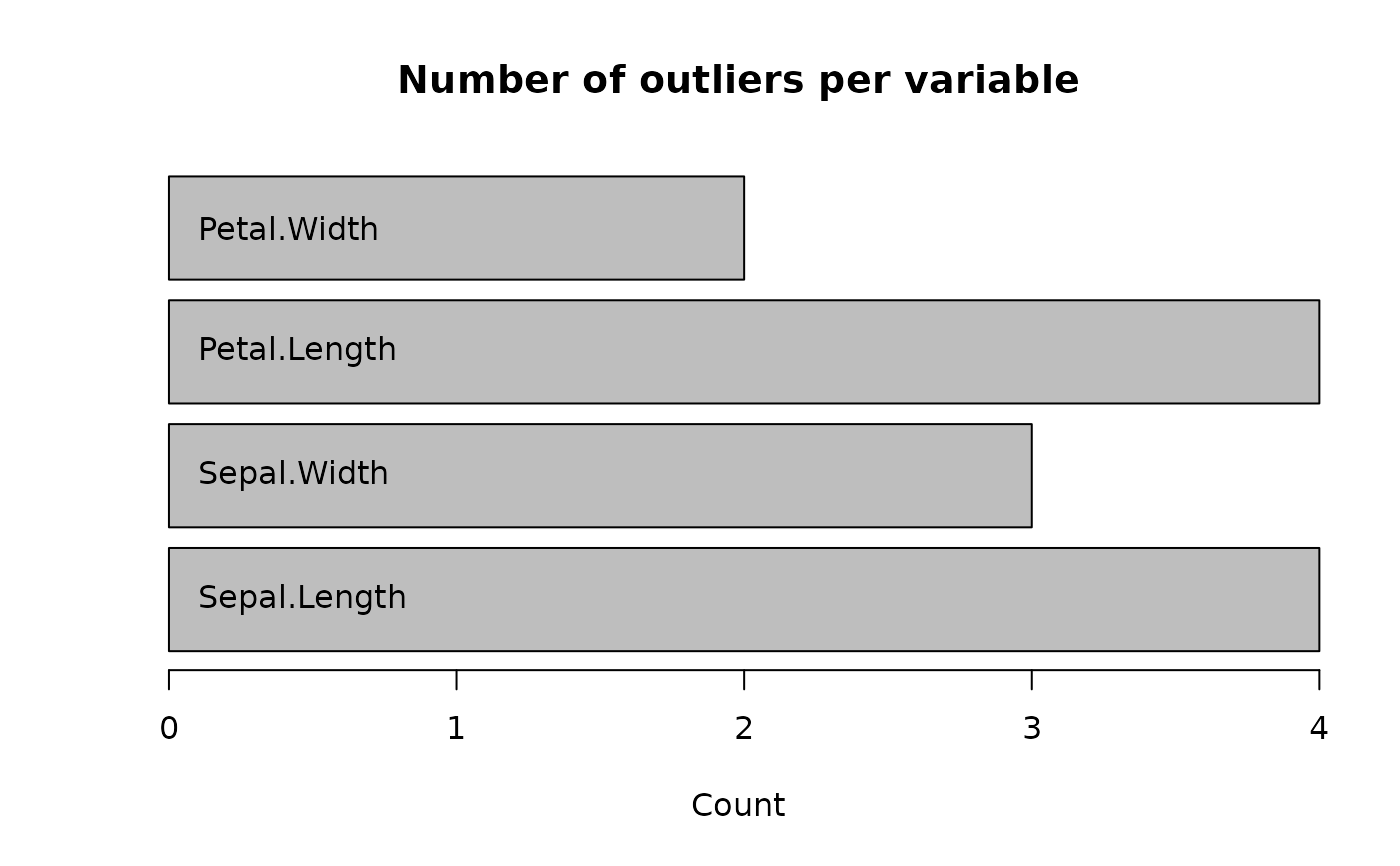
This function can plot aspects of an "outForest" object.
With
what = "counts", the number of outliers per variable is visualized as a barplot.With
what = "scores", outlier scores (i.e., the scaled difference between predicted and observed value) are shown as scatterplot per variable.
Arguments
- x
An object of class "outForest".
- what
What should be plotted? Either
"counts"(the default) or"scores".- ...
Arguments passed to
graphics::barplot()orgraphics::stripchart().
Value
A list.
Examples
irisWithOutliers <- generateOutliers(iris, seed = 345)
x <- outForest(irisWithOutliers, verbose = 0)
plot(x)

plot(x, what = "scores")
