This function prepares values for drawing a scatter plot of predicted values, responses, or residuals against a selected variable.
light_scatter(x, ...)

# Default S3 method
light_scatter(x, ...)

# S3 method for class 'flashlight'
light_scatter(
  x,
  v,
  data = x$data,
  by = x$by,
  type = c("predicted", "response", "residual", "shap"),
  use_linkinv = TRUE,
  n_max = 400,
  seed = NULL,
  ...
)

# S3 method for class 'multiflashlight'
light_scatter(x, ...)
Arguments
- x
An object of class "flashlight" or "multiflashlight".
- ...
Further arguments passed from or to other methods.
- v
The variable name to be shown on the x-axis.
- data
An optional
data.frame.- by
An optional vector of column names used to additionally group the results.
- type
Type of the profile: Either "predicted", "response", or "residual".
- use_linkinv
Should retransformation function be applied? Default is
TRUE.- n_max
Maximum number of data rows to select. Will be randomly picked.
- seed
An integer random seed used for subsampling.
Value
An object of class "light_scatter" with the following elements:
data: A tibble with results.by: Same as inputby.v: The variable name evaluated.type: Same as inputtype. For information only.
Methods (by class)
light_scatter(default): Default method not implemented yet.light_scatter(flashlight): Variable profile for a flashlight.light_scatter(multiflashlight): light_scatter for a multiflashlight.
See also
Examples
fit_a <- lm(Sepal.Length ~ . -Petal.Length, data = iris)
fit_b <- lm(Sepal.Length ~ ., data = iris)
fl_a <- flashlight(model = fit_a, label = "no Petal.Length")
fl_b <- flashlight(model = fit_b, label = "all")
fls <- multiflashlight(list(fl_a, fl_b), data = iris, y = "Sepal.Length")
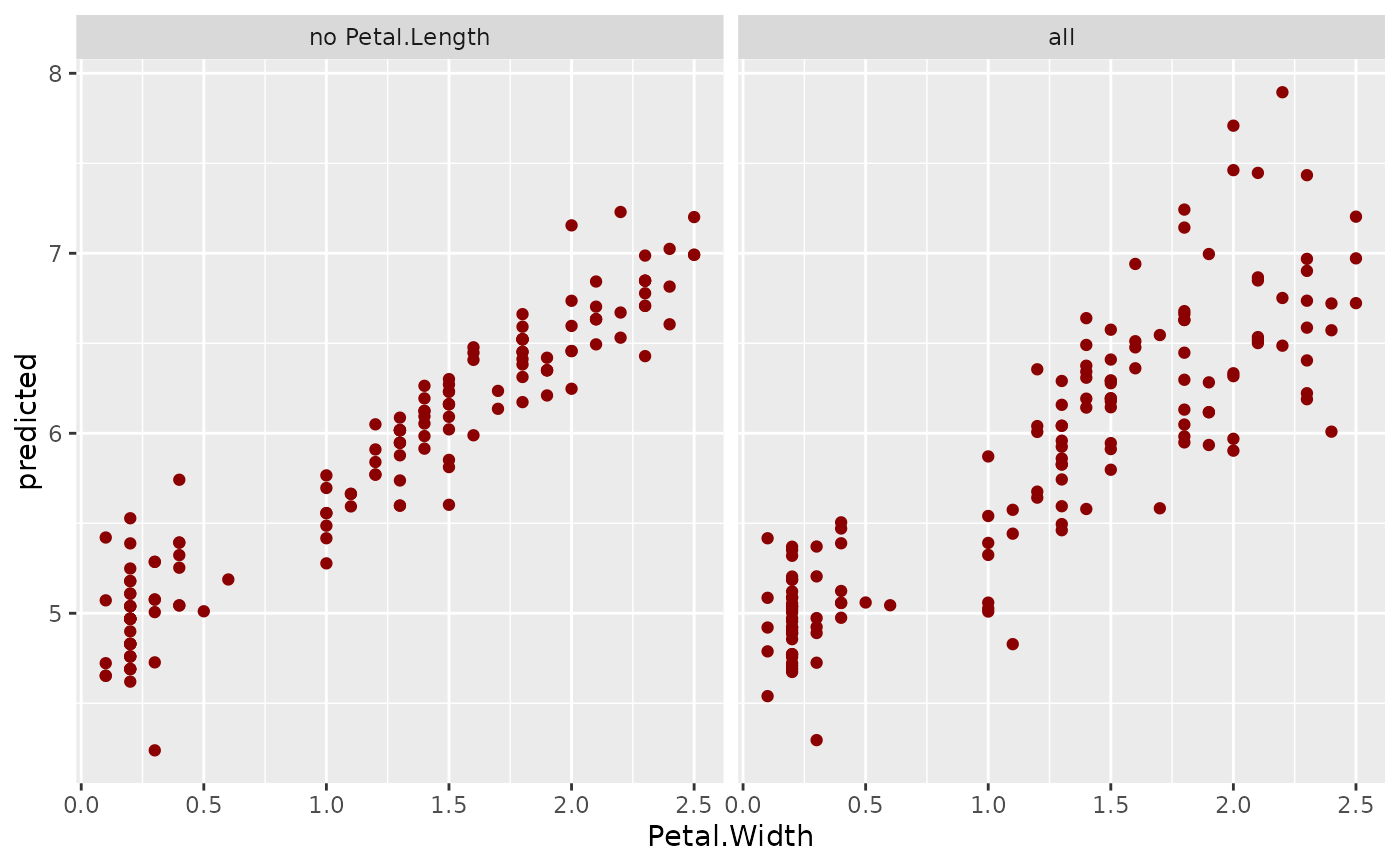
plot(light_scatter(fls, v = "Petal.Width"), color = "darkred")
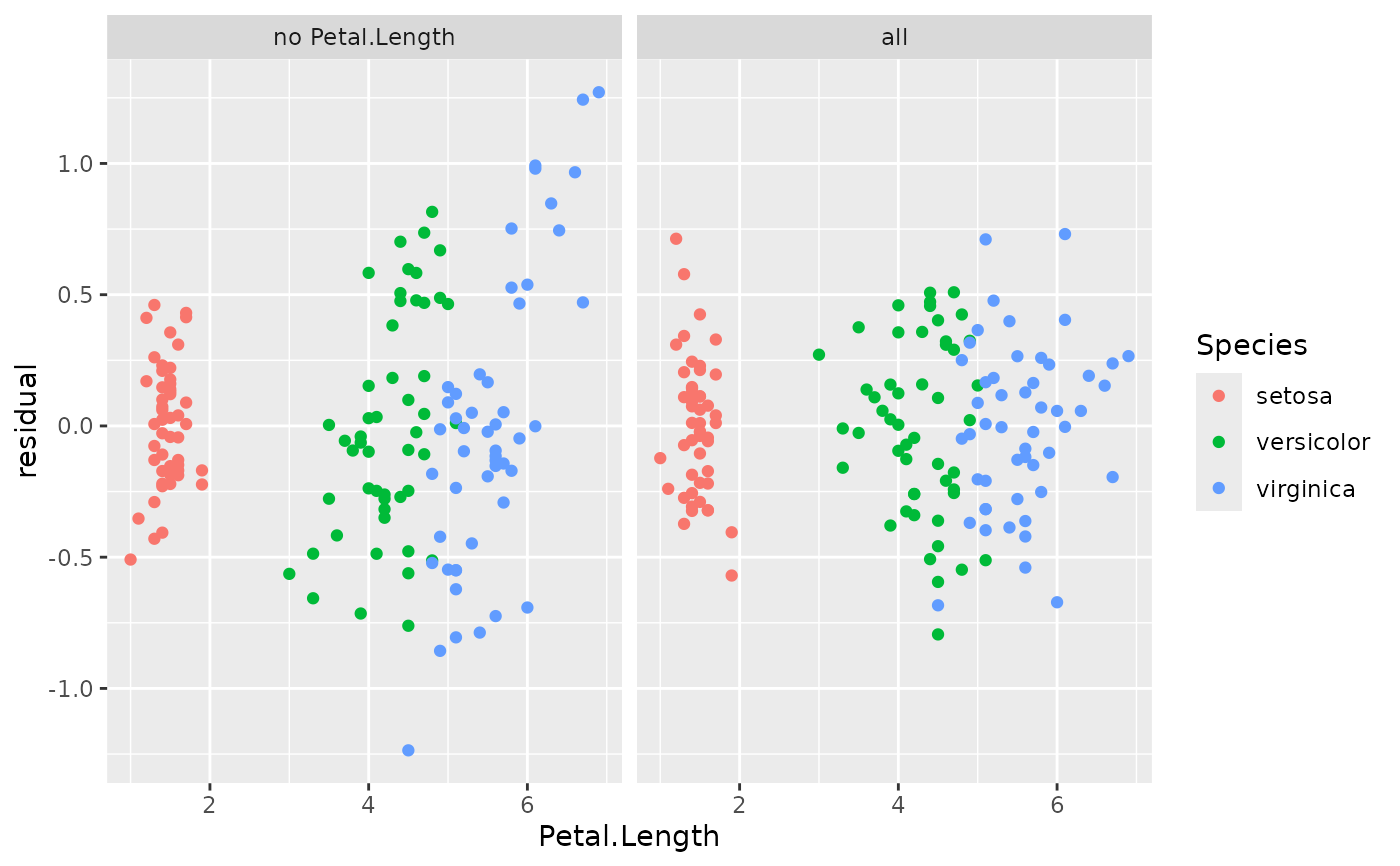
 sc <- light_scatter(fls, "Petal.Length", by = "Species", type = "residual")
plot(sc)
sc <- light_scatter(fls, "Petal.Length", by = "Species", type = "residual")
plot(sc)