Variable Contribution Breakdown for Single Observation
Source:R/light_breakdown.R
light_breakdown.RdCalculates sequential additive variable contributions (approximate SHAP) to the prediction of a single observation, see Gosiewska and Biecek (see reference) and the details below.
light_breakdown(x, ...)

# Default S3 method
light_breakdown(x, ...)

# S3 method for class 'flashlight'
light_breakdown(
  x,
  new_obs,
  data = x$data,
  by = x$by,
  v = NULL,
  visit_strategy = c("importance", "permutation", "v"),
  n_max = Inf,
  n_perm = 20,
  seed = NULL,
  use_linkinv = FALSE,
  description = TRUE,
  digits = 2,
  ...
)

# S3 method for class 'multiflashlight'
light_breakdown(x, ...)
Arguments
- x
An object of class "flashlight" or "multiflashlight".
- ...
Further arguments passed to
prettyNum()to format numbers in description text.- new_obs
One single new observation to calculate variable attribution for. Needs to be a
data.frameof same structure asdata.- data
An optional
data.frame.- by
An optional vector of column names used to filter
datafor rows with equal values in "by" variables asnew_obs.- v
Vector of variable names to assess contribution for. Defaults to all except those specified by "y", "w" and "by".
- visit_strategy
In what sequence should variables be visited? By "importance", by
n_perm"permutation" or as "v" (see Details).- n_max
Maximum number of rows in
datato consider in the reference data. Set to lower value ifdatais large.- n_perm
Number of permutations of random visit sequences. Only used if
visit_strategy = "permutation".- seed
An integer random seed used to shuffle rows if
n_maxis smaller than the number of rows indata.- use_linkinv
Should retransformation function be applied? Default is
FALSE.- description
Should descriptions be added? Default is
TRUE.- digits
Passed to
prettyNum()to format numbers in description text.
Value
An object of class "light_breakdown" with the following elements:
dataA tibble with results.bySame as inputby.
Details
The breakdown algorithm works as follows: First, the visit order
\((x_1, ..., x_m)\) of the variables v is specified.
Then, in the query data, the column \(x_1\) is set to the value of \(x_1\)
of the single observation new_obs to be explained.
The change in the (weighted) average prediction on data measures the
contribution of \(x_1\) on the prediction of new_obs.
This procedure is iterated over all \(x_i\) until eventually, all rows
in data are identical to new_obs.
A complication with this approach is that the visit order is relevant,
at least for non-additive models. Ideally, the algorithm could be repeated
for all possible permutations of v and its results averaged per variable.
This is basically what SHAP values do, see the reference below for an explanation.
Unfortunately, there is no efficient way to do this in a model agnostic way.
We offer two visit strategies to approximate SHAP:
"importance": Using the short-cut described in the reference below: The variables are sorted by the size of their contribution in the same way as the breakdown algorithm but without iteration, i.e., starting from the original query data for each variable \(x_i\).
"permutation": Averages contributions from a small number of random permutations of
v.
Note that the minimum required elements in the (multi-)flashlight are a
"predict_function", "model", and "data". The latter can also directly be passed to
light_breakdown(). Note that by default, no retransformation function is applied.
Methods (by class)
light_breakdown(default): Default method not implemented yet.light_breakdown(flashlight): Variable attribution to single observation for a flashlight.light_breakdown(multiflashlight): Variable attribution to single observation for a multiflashlight.
References
A. Gosiewska and P. Biecek (2019). IBREAKDOWN: Uncertainty of model explanations for non-additive predictive models. ArXiv.
See also
Examples
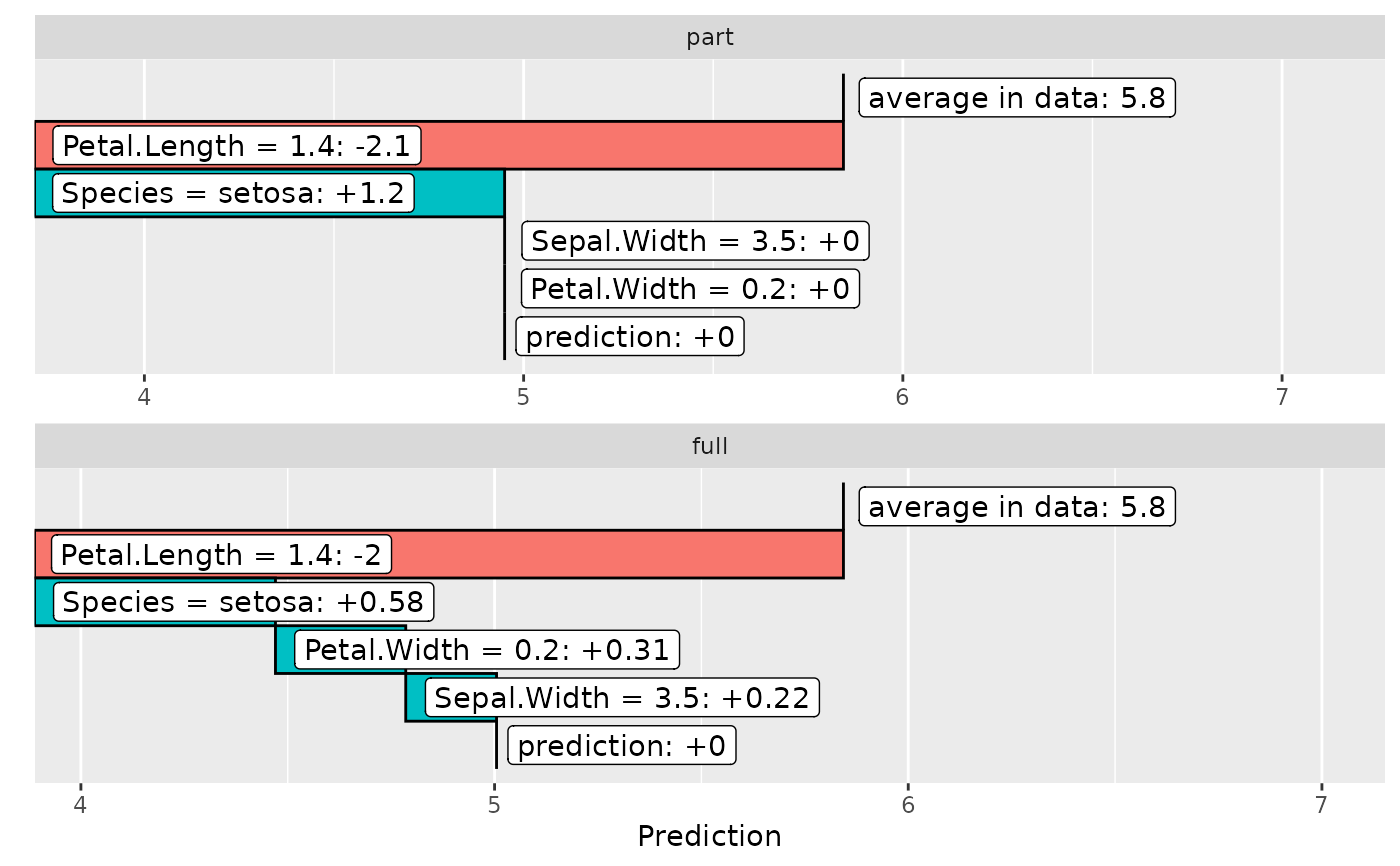
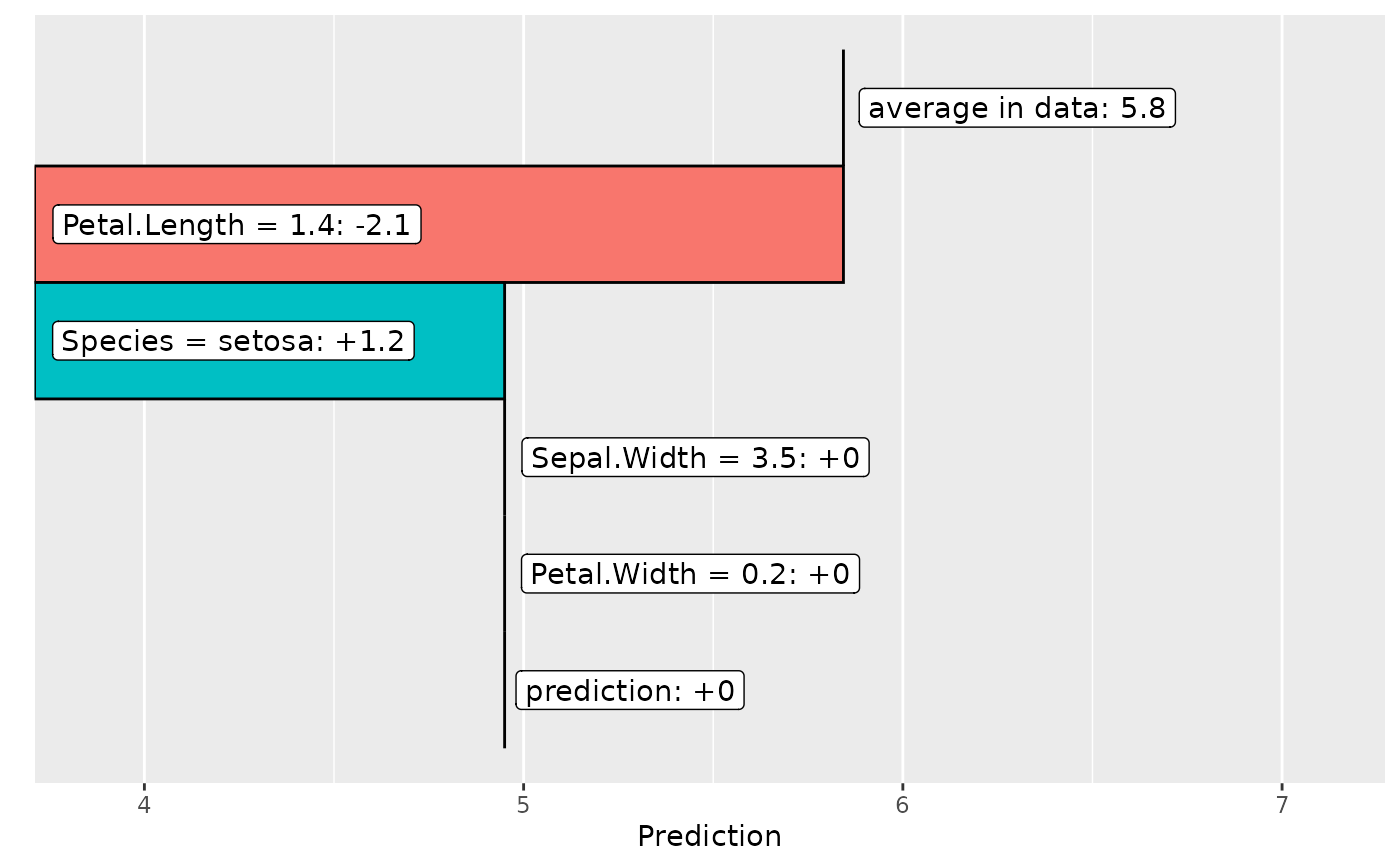
fit_part <- lm(Sepal.Length ~ Species + Petal.Length, data = iris)
fl_part <- flashlight(
  model = fit_part, label = "part", data = iris, y = "Sepal.Length"
)
plot(light_breakdown(fl_part, new_obs = iris[1, ]))


# Second model
fit_full <- lm(Sepal.Length ~ ., data = iris)
fl_full <- flashlight(
  model = fit_full, label = "full", data = iris, y = "Sepal.Length"
)
fls <- multiflashlight(list(fl_part, fl_full))
plot(light_breakdown(fls, new_obs = iris[1, ]))
# Second model
fit_full <- lm(Sepal.Length ~ ., data = iris)
fl_full <- flashlight(
model = fit_full, label = "full", data = iris, y = "Sepal.Length"
)
fls <- multiflashlight(list(fl_part, fl_full))
plot(light_breakdown(fls, new_obs = iris[1, ]))