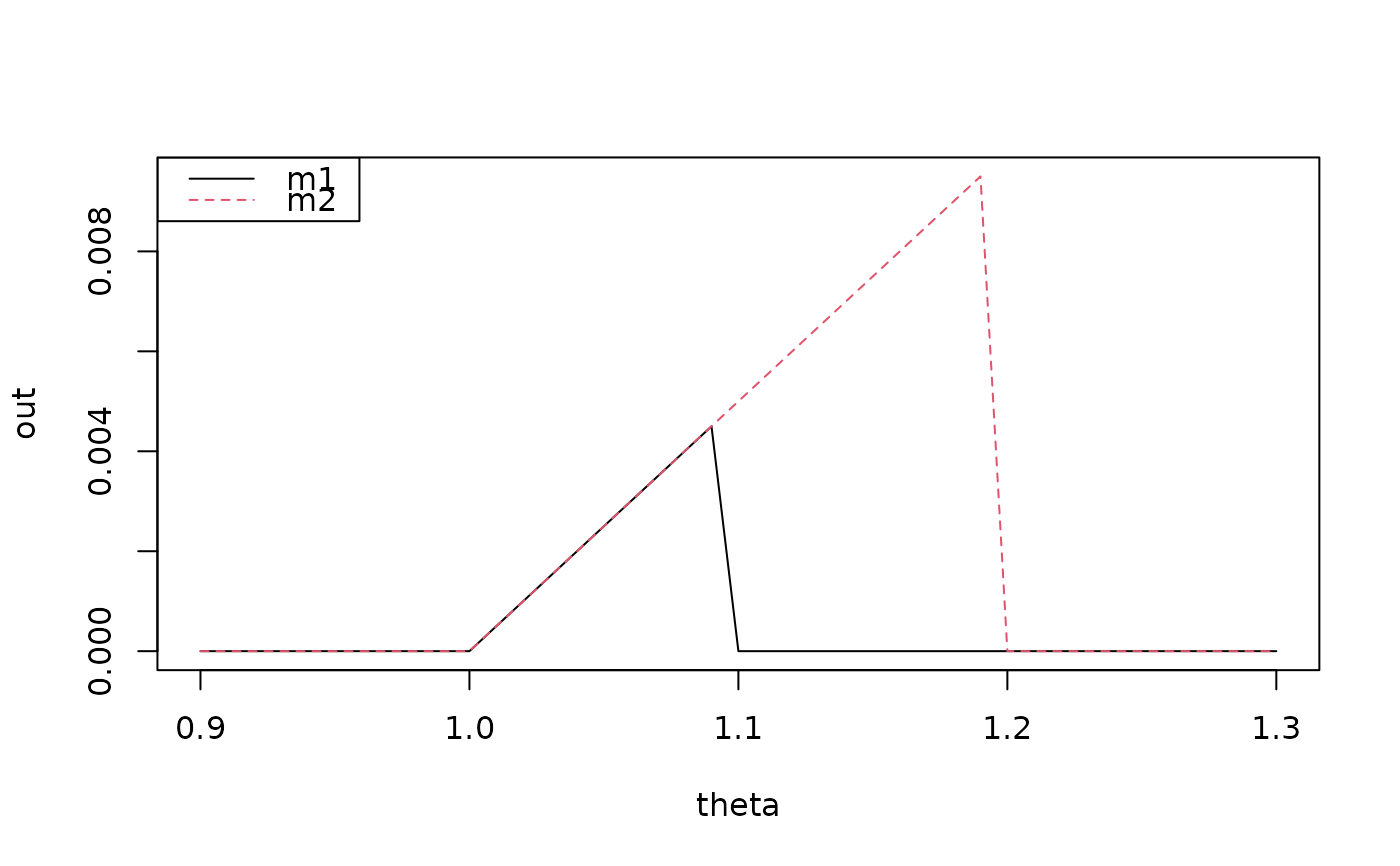
Murphy diagram of the elementary scoring function for expectiles/quantiles at level \(\alpha\) for different values of \(\theta\). Can be used to study and compare performance of one or multiple models.
Arguments
- actual
Observed values.
- predicted
Predicted values.
- w
Optional case weights.
- alpha
Level of expectile or quantile. The default
alpha = 0.5corresponds to the expectation/median.- theta
Vector of evaluation points.
- functional
Either "expectile" or "quantile".
- plot
Should a plot be returned (default is
TRUE)? IfFALSE, adata.framecontaining the results.- ...
Further arguments passed to
graphics::matplot().
Value
The result of graphics::matplot() or a data.frame containing the results.
Details
If the plot needs to be customized, set plot = FALSE to get the
resulting data instead of the plot.
References
Ehm, W., Gneiting, T., Jordan, A. and Krüger, F. (2016), Of quantiles and expectiles: consistent scoring functions, Choquet representations and forecast rankings. J. R. Stat. Soc. B, 78: 505-562, <doi.org/10.1111/rssb.12154>.